XSLT Debugger
With the eiConsole’s Data Mapper, users can debug XSLT through Step-by-Step Execution, XPath Statement Evaluations, Live Output and a variety of tabs for Displaying Ongoing Information.
The XSLT Debugger is a component of the Data Mapper that enables the user to debug XSLT through step-by-step execution, XPath statement evaluations, live output and a variety of tabs for displaying ongoing information. As with all the components of the eiConsole, the user is presented with a graphical interface with easy to configure panels and menus.
The XSLT Debugger is accessed via the Data Mapper by selecting the “Debug Transformation” button from within the Data Mapper testing mode.
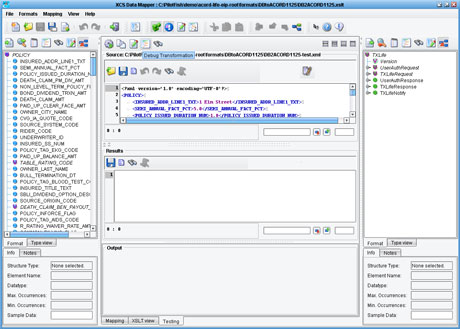
Once opened, the XSLT Debugger can be seen to be composed of four panels.
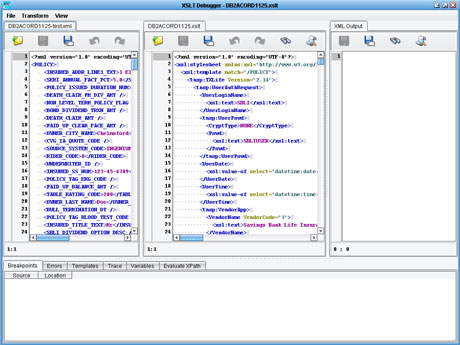
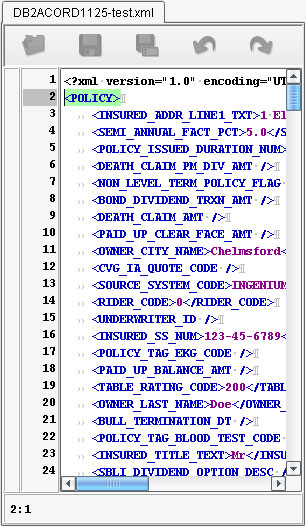
The left-most panel is the Source Document Panel, which displays the current document to be used as the transformation source.
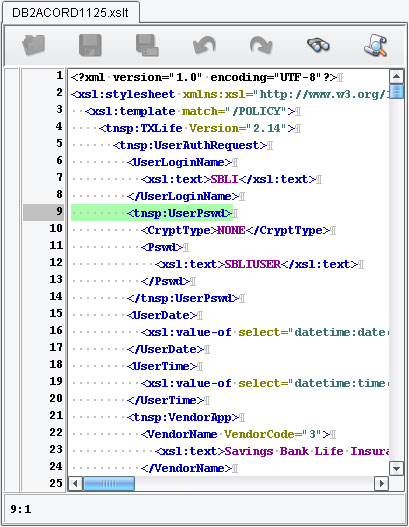
The center panel is the XSLT Document Panel, which displays the XSLT transformation document to be tested.
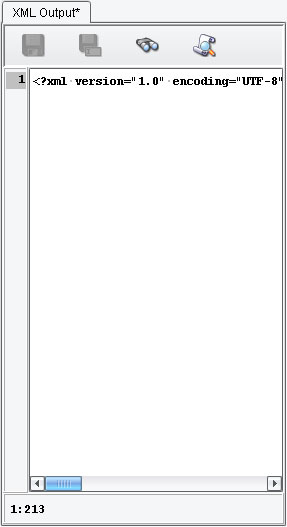
The right-most panel is the Output Document Panel, which displays the XSLT transformation results up to the most currently executed step.
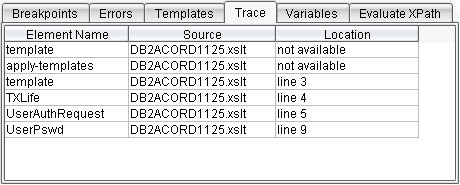
The last (bottom-most) panel is the Expressions Table Panel, which displays information for various categories.
For more information please call us at 860 632 9900 or click the link below to email us.
